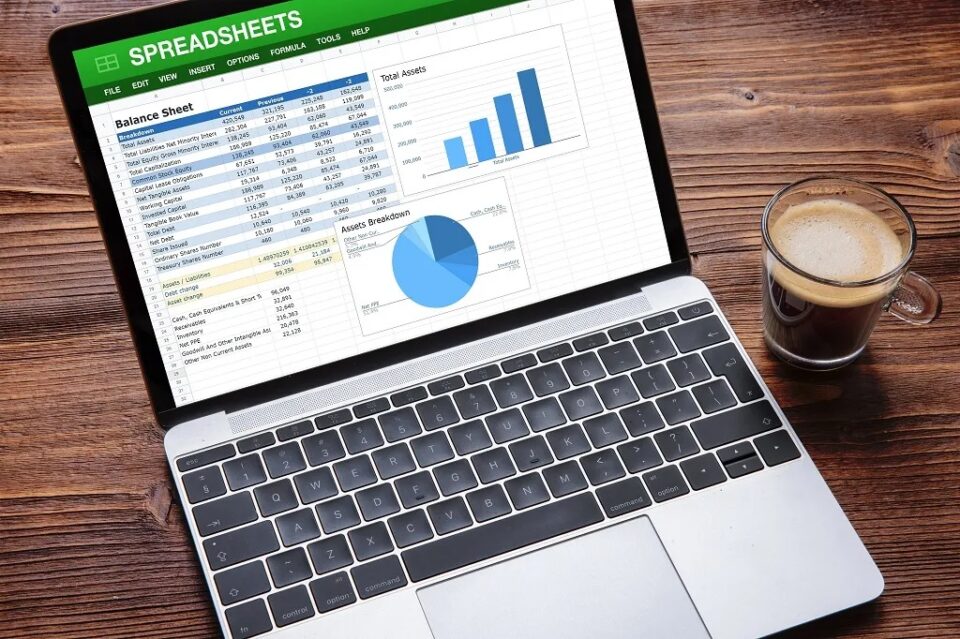
In the realm of finance and accounting, robust financial reporting is paramount for informed decision-making and organizational success. Excel, with its versatility and functionality, remains a cornerstone tool for financial professionals. However, mastering advanced excel tools can significantly enhance the efficiency, accuracy, and visual appeal of financial reporting processes. In this article, we’ll explore the pivotal role of advanced excel tools in enhancing financial reporting and provide insights into how finance professionals can leverage these tools effectively.
1. Pivottables: unleashing data insights
Powerful data analysis: pivottables enable finance professionals to analyze large datasets swiftly and gain valuable insights into financial performance, trends, and anomalies.
Dynamic reporting: create dynamic reports that summarize financial data based on different dimensions, such as time periods, product lines, or business units, with just a few clicks.
2. Advanced formulas and functions: maximizing efficiency
Complex calculations: harness the power of advanced formulas and functions, such as vlookup, index-match, sumifs, and concatenate, to perform complex calculations and automate repetitive tasks.
Error reduction: minimize errors and improve accuracy by using error-checking functions like iferror and auditing tools to trace formula dependencies and identify discrepancies.
3. Data visualization with charts and graphs: communicating insights effectively
Visual representation: create dynamic charts and graphs, including line charts, bar charts, and pie charts, to visually communicate financial trends, comparisons, and forecasts.
Interactive dashboards: design interactive dashboards that consolidate key financial metrics and kpis into a single, user-friendly interface, allowing stakeholders to explore data dynamically and make data-driven decisions.
4. Conditional formatting: highlighting key insights
Visual cues: apply conditional formatting rules to highlight important trends, outliers, and exceptions in financial data, making it easier for users to identify and interpret critical information.
Color scales and icon sets: utilize color scales, icon sets, and data bars to visualize data variations and performance rankings, adding context and clarity to financial reports.
5. Data analysis tools: exploring advanced insights
What-if analysis: conduct scenario analysis and sensitivity testing using excel’s data analysis tools, such as scenario manager and goal seek, to evaluate the impact of different assumptions on financial outcomes.
Regression analysis: perform regression analysis to identify relationships between variables and predict future trends, helping organizations make informed strategic decisions based on data-driven insights.
6. Automation and macros: streamlining processes
Macro recording: record and automate repetitive tasks with excel macros, enabling finance professionals to streamline routine processes, such as data imports, formatting, and report generation.
Vba programming: dive deeper into automation with visual basic for applications (vba) programming, allowing customization and integration with external data sources and applications for enhanced efficiency.
Conclusion: excel empowerment for financial reporting excellence
In conclusion, advanced excel tools empower finance professionals to elevate the quality, accuracy, and efficiency of financial reporting processes. By mastering pivottables for data analysis, leveraging advanced formulas for complex calculations, visualizing insights with charts and graphs, utilizing conditional formatting for highlighting key information, exploring advanced data analysis tools for deeper insights, and automating tasks with macros and vba programming, finance professionals can unlock the full potential of excel for financial reporting excellence. Embrace these advanced excel techniques to streamline workflows, drive data-driven decision-making, and enhance organizational performance in today’s dynamic business environment.

